Category: Marketing
Most digital marketers waste their advertising budgets unnecessarily. They only check message delivery rates. They stop tracking performance at that exact point. The reality behind SMS analytics metrics differs greatly. These metrics go far beyond simple delivery confirmation. They reveal the true indicators that drive store profits. I once managed a project for an e-commerce client. We sent twenty thousand text messages to his list. Reports showed a ninety-seven percent delivery rate initially. We celebrated the campaign success immediately. But one week later, the client asked about sales. I checked the analytics dashboard carefully. I only saw vague click counts without context. No numbers linked those clicks to actual revenue. I felt I had deceived myself before deceiving the client. That night, I connected his store to Omnisend. I added custom tracking tags to every single link. The results shocked our entire marketing team. Manual campaigns generated only twelve cents per message. Behavioral automation messages generated sixty-eight cents consistently. We immediately cut the random campaigns entirely. We focused on abandoned cart automation flows. Total ROI jumped to seventy-one cents per message.
- Why SMS analytics differs from email analytics
- The seven key metrics in SMS analytics
- The massive gap between broadcast campaigns and message automation
- Benchmark standards and how to set up conversion tracking
- Extracting data and analyzing patterns using available tools
- Key metric tracking strategy to improve ROI
- Engineering hidden profit: How an A/B test revealed the 192% secret?
Why SMS analytics differs from email analytics
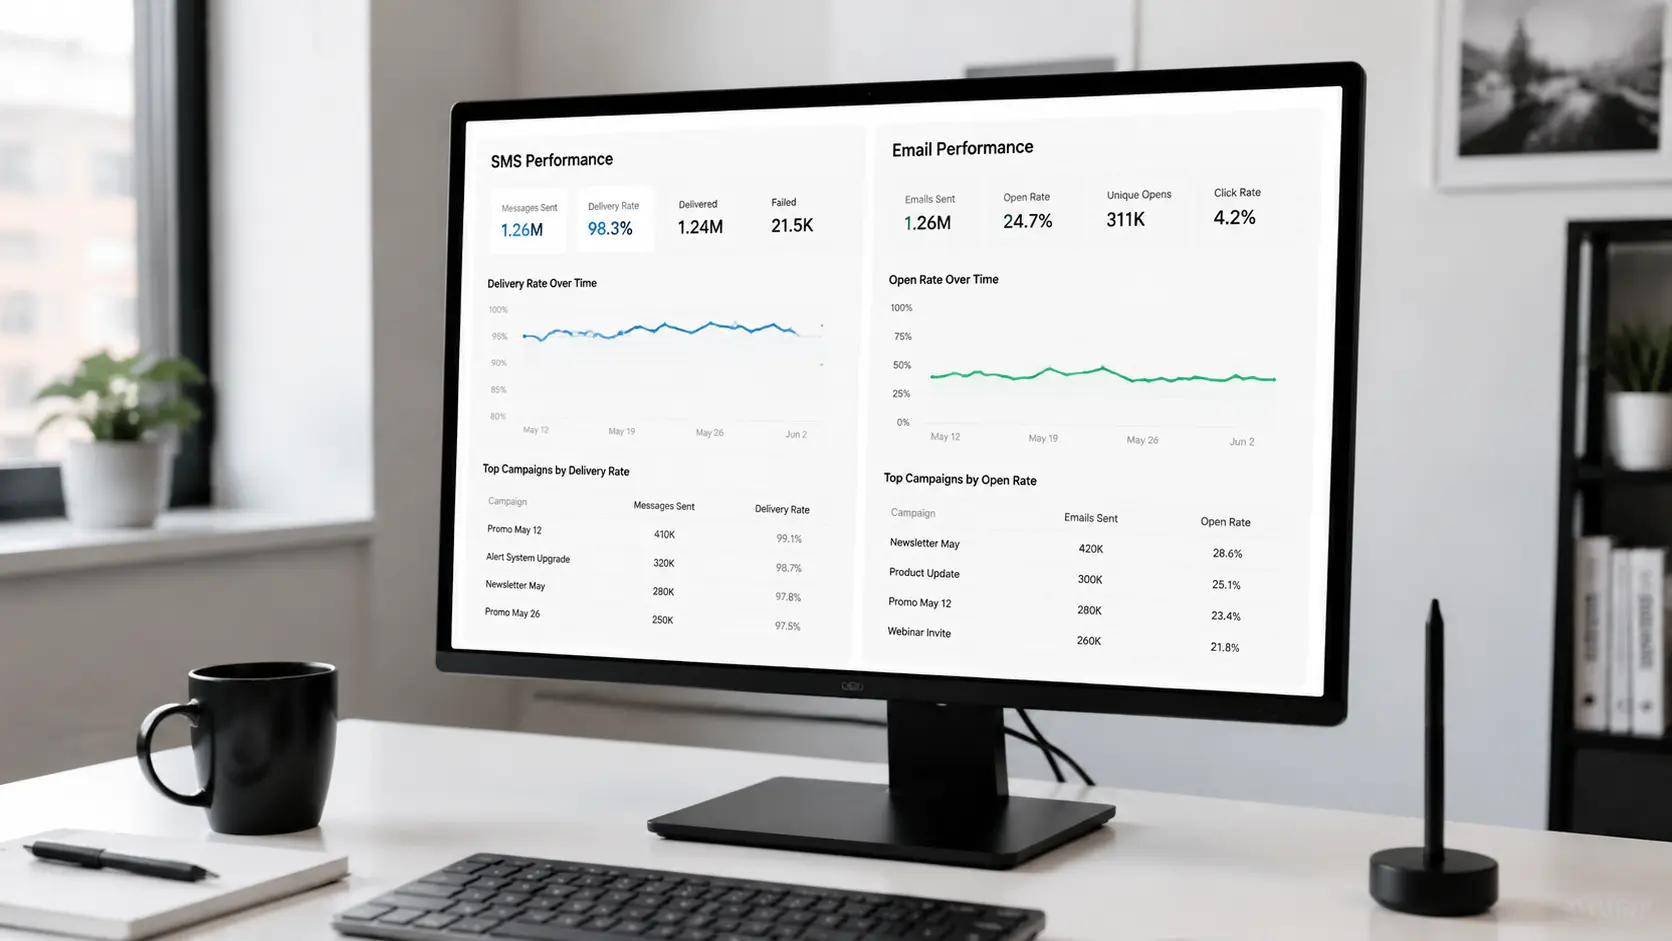
Many professionals believe managing texts mirrors email management. This technical assumption causes massive financial losses. Interaction patterns differ significantly between both channels. Regulations differ across multiple jurisdictions. Tracking methods differ completely. You need a completely different analytical mindset.
The illusion of open rates and carrier dependencies
Short messages lack reliable read receipts. Platforms cannot measure them like standard emails. Most phones open texts automatically upon receipt. Measuring an open rate is technically inaccurate. Filtering and blocking rely on secret carrier algorithms. Local telecom companies apply these rules privately. They do not share them with senders. A ninety-five percent email delivery means server acceptance. A ninety-five percent SMS delivery means actual device arrival.
Permanent unsubscribes and their impact on list quality
When a customer texts STOP, the command executes instantly. It happens directly at the carrier network level. This action is permanent and irreversible. You cannot reverse it manually. The customer must explicitly re-opt in. Rising opt-out rates trigger strict carrier scrutiny. Your sending number faces intense review. Your sender ID could face a complete ban. This threatens your marketing investments permanently. Understanding these core differences prepares you for real revenue data. Focus on numbers that actually drive store sales.
The seven key metrics in SMS analytics
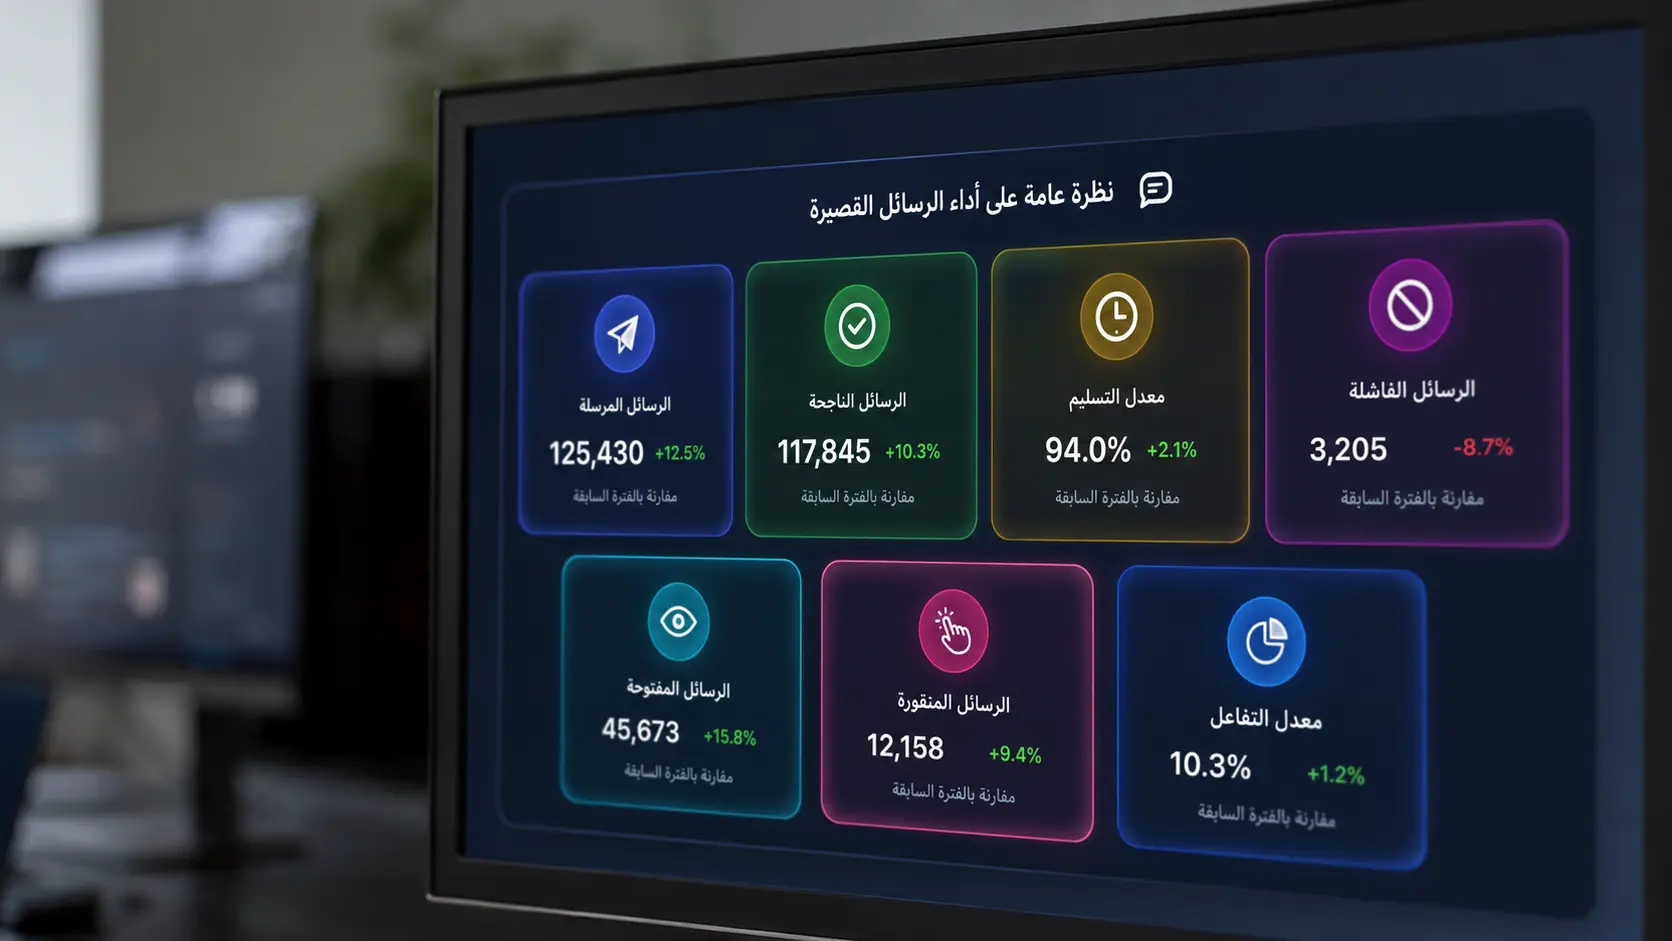
Data tracking splits into seven core indicators. These metrics give you full visibility. You will see the customer journey clearly. Focusing on these numbers protects you. You will avoid decisions based on false impressions. These impressions rarely reflect your store financial reality.
Delivery and click rates as primary indicators
Delivery rate forms the statistical foundation. Every other campaign metric depends on it. Calculate it by dividing delivered messages by sent messages. Multiply by one hundred for accuracy. Your rate must never drop below ninety-five percent. Click-through rate measures offer appeal directly. It tests your call-to-action strength effectively. Recent data from the Email and Ecommerce Marketing Report shows global click rates doubled.
Revenue per send and revenue per subscriber
Revenue per send acts as your guiding star. It merges delivery, engagement, and conversion. Calculate it by dividing total channel revenue by messages sent. Use a specific time frame for accuracy. Revenue per subscriber reveals true list value. It shows long-term financial worth clearly. Remember that a small engaged list outperforms a large inactive one. Financially, quality always beats quantity.
Growth rate and opt-out rate
Growth rate measures net new subscribers accurately. Subtract departures from the total starting list. This shows your actual audience expansion. A declining rate signals a clear flaw. Your acquisition methods or content quality need fixing. Keep your opt-out rate below zero-point-three percent per campaign. This ensures network safety consistently. Exceeding zero-point-five percent is a serious warning. Review your message frequency immediately. Check audience relevance carefully.
The massive gap between broadcast campaigns and message automation
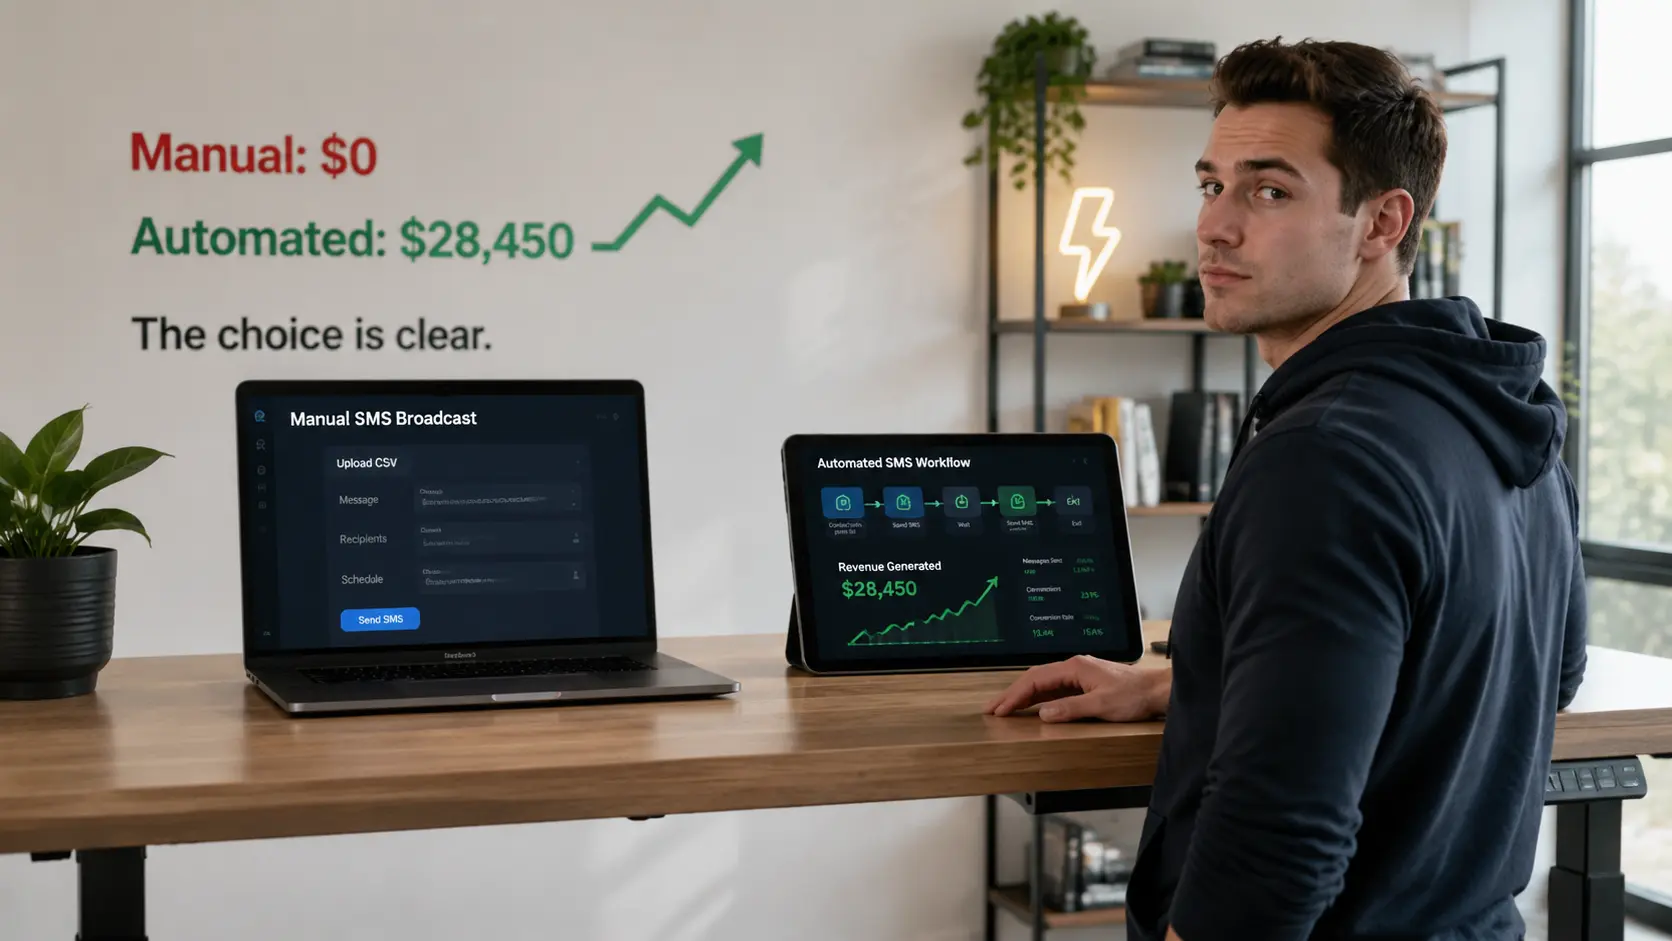
Not all text messages yield equal financial returns. Mixing them up harms your marketing channel. Data reveals a deep performance gap. Broadcast messages lag behind behavioral automations.
Why automation yields $0.74 vs $0.15 for campaigns?
This fivefold difference stems from precise timing. Context dictates when the message arrives. Abandoned cart triggers hit during high interest. Purchase probability spikes immediately. Broadcast campaigns target wide segments simultaneously. Timing often misses current buying intent. Financial returns stay low for broadcasts. Automated messages meet immediate needs. They drive faster conversions.
How to track drop-off points in automation flows
Automations usually contain sequential message chains. Monitor your flow completion rate closely. This metric identifies exact drop-off points. You will see where customers unsubscribe. Conversion drops after message two? Timing might be too tight. The offer may lack appeal. Adjust wait periods carefully. Test different incentives. Re-engage customers without annoying them. Frequent irritation damages your brand reputation.
Benchmark standards and how to set up conversion tracking
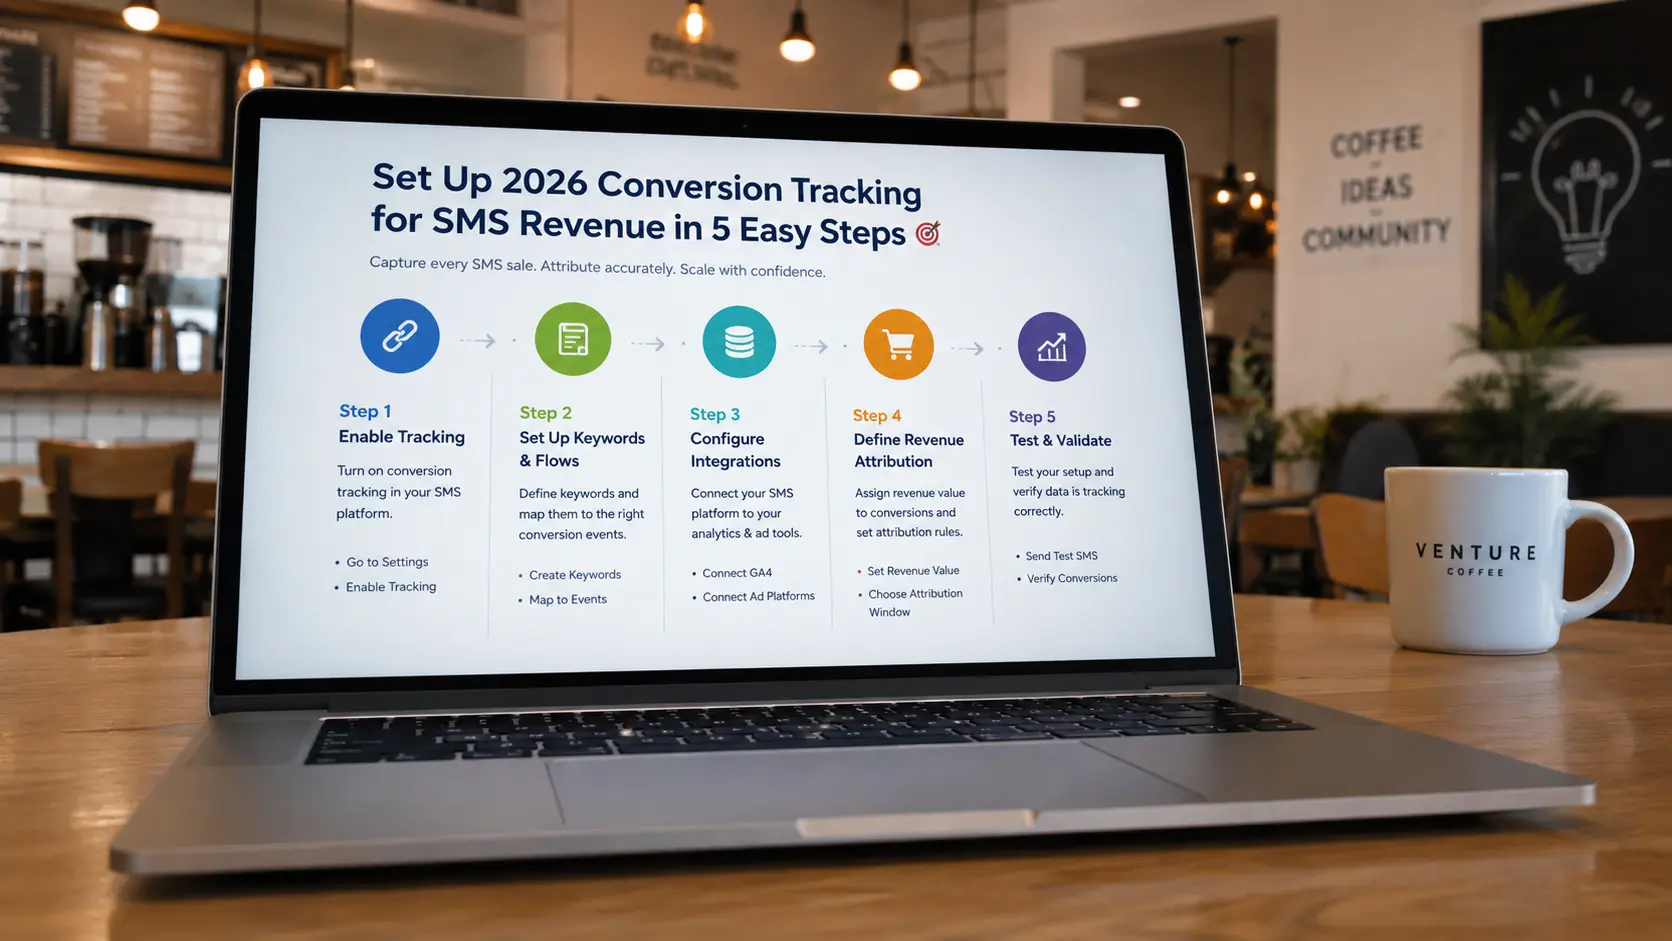
Monitoring numbers without benchmarks limits analysis. You cannot apply insights to boost profits. You need healthy thresholds for each metric. You also need technical steps. Connect this data to direct store sales.
Healthy and warning performance standards for 2026
Benchmarks highlight campaign weaknesses quickly. You can take corrective action immediately. Protect your subscribers from leaving.
| Marketing Metric | Target Healthy Rate | Danger Warning Signal |
|---|---|---|
| Delivery Rate | 95% or higher | Below 90% (list quality issues) |
| Click-Through Rate (CTR) | 3% to 7% | Below 2% (unappealing offer) |
| Opt-out Rate | Below 0.3% | Above 0.5% (annoyance or frequency) |
| Revenue per Send (Campaigns) | Approximately $0.15 | Below $0.10 (poor targeting) |
| Revenue per Send (Automation) | Approximately $0.74 | Below $0.30 (wrong trigger timing) |
Setting up UTM tags and connecting ecommerce platforms
Track sales accurately across all marketing channels. Add UTM tags to every SMS link carefully. Use this structure for correct traffic classification always. Google Analytics and dashboards will categorize it properly. Connect your SMS platform to your store securely. Shopify or WooCommerce integration works well for you. The platform will read sales data automatically today. It will link purchases to messages directly now. Separate UTM tags for broadcasts carefully today. Use different tags for automations carefully now. Evaluate each channel independently for accuracy consistently.
<!-- Example tracking link for a winter sale campaign -->
https://yourstore.com/discount?utm_source=sms&utm_medium=text&utm_campaign=winter_sale_2026
Extracting data and analyzing patterns using available tools

Viewing the main dashboard is insufficient. You need deep details. Export raw data to discover backstage patterns. Avoid misleading surface readings.
Export button and CSV file analysis
I once used the Export button in our reporting toolbar. It pulled comprehensive CSV files for our clients. You find this feature by clicking Export. Look at the top right corner of the grid. Download the full data set. Apply the right filters first. Open these files in spreadsheet software. Analyze detailed purchase behavior. Identify clear patterns. This process helped us present accurate reports. Stakeholders received clear, undeniable facts.
Avoiding common mistakes in reading reports
I deeply frustrate when marketers ignore details. They only check overall averages. Relying on general averages hides real problems. A whole segment might ignore your offers. They drain your sending budget. Zero return justifies this caution. Export data regularly. Audit it carefully. Stop wasting money on inactive numbers. Avoid wrong marketing segments. This precise analysis leads to sustainable tracking. It ensures continuous financial growth for your store.
Key metric tracking strategy to improve ROI
Maximizing your marketing budget requires organization. Build a consistent tracking process. Improve performance quickly. Avoid costly mistakes. Numbers do not jump randomly. They require deliberate steps. Transform silent data into real profit decisions.
Implementing key metric tracking strategy
I applied a strict Key metric tracking strategy. I committed to daily practical steps. We open SMS/MMS reports regularly. We apply specific date filters. We log core metrics in a custom dashboard. Record delivery rates consistently. Log clicks and conversions. Track revenue periodically. Monitor any sudden performance shifts. Address them immediately. This methodology protects campaigns from sudden drops. It ensures stable marketing ROI.
Monthly review and filter adjustments to improve performance
Monthly reviews reveal weak trends. Adjust your filters and segments. Improve upcoming campaigns continuously. Notice a segment declining? Modify filtering conditions. Change content targeting for them. Use complementary channels to multiply results. Read our guide on SMS marketing for restaurants via strategies that boost orders to increase loyalty. This continuous evaluation keeps your list active. Every message pushes the buyer closer to purchase.
Engineering hidden profit: How an A/B test revealed the 192% secret?
In mid-2025, I optimized campaigns for a natural cosmetics store. The dashboard showed decent overall numbers. I felt wasted energy in the subscriber list. I launched strict A/B tests. I focused on three elements only. Direct offer wording. Send timing. Custom short links. Short links avoid carrier filter suspicion. We created two versions. Version one used a standard percentage discount. It used a long link. Version two offered a specific free gift. It used a custom short link. It sent during evening rest hours. The result exceeded expectations. Revenue from this segment jumped over 190%. It beat previous untested campaigns. The lesson is clear. The gap between average and exceptional campaigns lies in details. Comparative tests reveal these details. Platforms that simplify variable testing keep you blind. You lose money without knowing why.
FAQ
What is SMS analytics?
It tracks text campaign performance. You monitor core indicators. Delivery rate, clicks, conversions, and revenue guide you. This analysis shows what works. It highlights what needs improvement. Ensure marketing success. Maximize subscriber list value.
How much revenue does SMS analytics reveal?
Automated messages generate about seventy-four cents per send. Broadcast campaigns only yield fifteen cents. This massive gap proves a point. Ignoring revenue metrics costs money. Target customer behavior at the right time. Capture missed revenue opportunities.
What differs between SMS and email analytics?
Email analytics rely on open rates. They use long engagement windows. SMS focuses on delivery and clicks. It tracks instant conversions. SMS unsubscribes are permanent. Carriers enforce them instantly. Email relies on server acceptance. The underlying mechanics differ completely.
How do I set up conversion tracking in SMS?
Add UTM parameters to every link. Connect your SMS platform to your store. Link purchases directly to messages. Track broadcasts separately. Track automations separately. Identify revenue sources accurately.
Is SMS analytics reliable for campaign evaluation?
Yes, it is highly reliable. Focus on revenue per send. Gain precise list quality insights. Measure targeting effectiveness. Identify delivery issues early. Catch high opt-out rates before profits drop.
Conclusion of the experience
Measuring texts by delivery rate alone wastes budget. It yields zero results. Real analysis starts at the click. Link every click to a purchase. Calculate exact financial return per message. Adjust tracking tags today. Separate manual reports from automations. See your store true numbers. What is your current revenue per sent message? Have you separated automation tracking from regular campaigns?
Discover more from أشكوش ديجيتال
Subscribe to get the latest posts sent to your email.
![ضاعف أرباح إعلانات Google Ads للفروع المتعددة [5 أسرار]](https://hcouchd.com/wp-content/uploads/2026/09/file_0000000060c081f58e0e7cfa4922ea6d-1024x576.webp)